> ## Documentation Index
> Fetch the complete documentation index at: https://docs.haloxlabs.ai/llms.txt
> Use this file to discover all available pages before exploring further.
# Pro sidebar feature map: menu roles and workflows
> The HaloX Pro sidebar connects keyword, prompt, strategy, site audit, content, monitoring, reporting, personas, and knowledge features into one GEO operating loop.
 ## What is this feature?
The **Pro sidebar** is the operating map for deeper HaloX work. After you click `Pro` in the left sidebar, HaloX opens Analysis, Strategy, Execution, Monitoring, and Misc as separate working surfaces.
## What is this feature?
The **Pro sidebar** is the operating map for deeper HaloX work. After you click `Pro` in the left sidebar, HaloX opens Analysis, Strategy, Execution, Monitoring, and Misc as separate working surfaces.
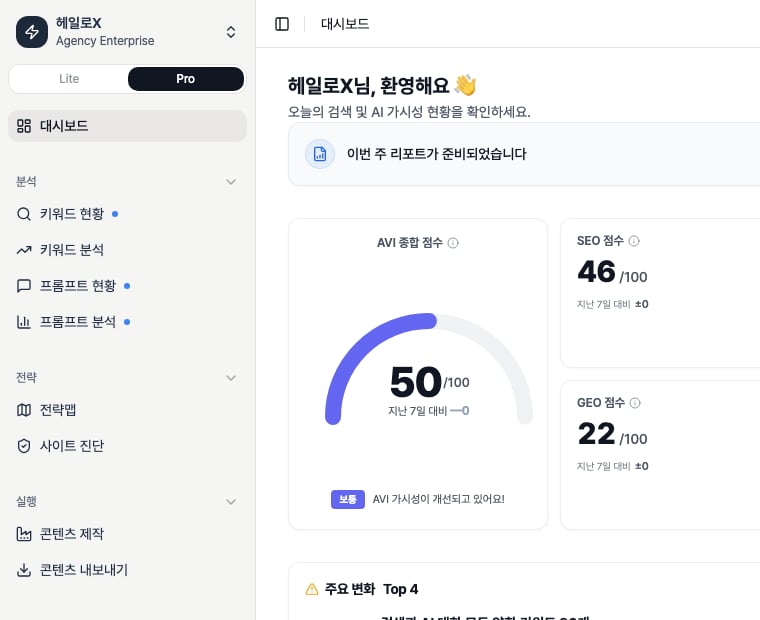 *This capture was taken after opening the HaloX workspace and clicking `Pro` in the left sidebar. Read the menu map against the Pro sidebar structure that continues through Analysis, Strategy, Execution, Monitoring, and Misc.*
## Sidebar structure
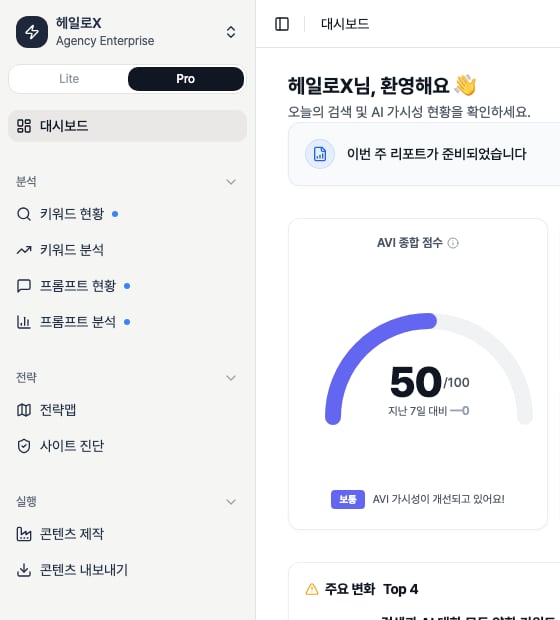
This page is based on the **sidebar after the Pro button is selected**, not on a Lite dashboard capture. In the app source, the menu order is Dashboard → Analysis → Strategy → Execution → Monitoring → Misc.
The crop below focuses the same actual app screen around the selected `Pro` toggle, expanded sidebar groups, and a slice of the dashboard body. Confirm the active Pro state first, then compare each menu with the role table.
*This capture was taken after opening the HaloX workspace and clicking `Pro` in the left sidebar. Read the menu map against the Pro sidebar structure that continues through Analysis, Strategy, Execution, Monitoring, and Misc.*
## Sidebar structure
This page is based on the **sidebar after the Pro button is selected**, not on a Lite dashboard capture. In the app source, the menu order is Dashboard → Analysis → Strategy → Execution → Monitoring → Misc.
The crop below focuses the same actual app screen around the selected `Pro` toggle, expanded sidebar groups, and a slice of the dashboard body. Confirm the active Pro state first, then compare each menu with the role table.
 | Area | Menu | Feature role | Next work |
| ---------- | -------------------- | ----------------------------------------------------------- | ----------------------------------------- |
| Analysis | Keyword Status | Review SEO/AIO/GEO status and freshness by keyword | Select priority keywords, improve content |
| Analysis | Keyword Analysis | Review search performance and page/query movement | Monitor GSC/GA4 signals |
| Analysis | Prompt Status | Review mentions, sources, and citations across AI questions | Improve prompt sets, track engines |
| Analysis | Prompt Analysis | Interpret AI answer patterns and competitive exposure | Citation tracking, source strategy |
| Strategy | Strategy Map | Prioritize cluster-level GEO/SEO/AIO opportunities | Content briefs, reclustering |
| Strategy | Site Audit | Split web health and AI readiness into technical issues | Development or SEO tickets |
| Execution | Content Factory | Connect strategy analysis, writing, and evidence | Drafts, delivery documents |
| Execution | Content Export | Package content and report data for delivery | Client delivery, internal sharing |
| Monitoring | Monitoring Dashboard | Track GSC/GA4 and HaloX signal changes | Weekly meetings, improvement checks |
| Monitoring | Weekly Report | Package changes and next actions into a report | Client meetings, executive reporting |
| Misc | Personas | Manage tone, role, and writing style | Inputs for Content Factory |
| Misc | Evidence Library | Manage product, topic, and source facts | Evidence-based content and source trust |
## What should you inspect by area?
Keyword Status uses list and network views. Prompt Status separates prompts and sets. Weaknesses found here should move into Strategy Map or Content Factory.
Strategy Map uses list, network, matrix, and detail panels. Site Audit uses Overview, Issues, Pages, SEO, and GEO tabs to separate technical, content, and source problems.
Content Factory starts from the job list and continues into strategy analysis, content writing, and evidence tabs. Export packages the final deliverable.
Monitoring Dashboard uses overview, queries, and pages tabs. Weekly Report turns signal changes into a narrative and next actions.
## Tabs that must be documented
| Feature | Key tabs/views | Why it matters |
| ---------------------- | ------------------------------------------------- | ---------------------------------------------------------- |
| Keyword Status | List, Network | Keywords should be read as both rows and relationships. |
| Prompt Status | Prompts, Sets | Question analysis and operating sets need different views. |
| Strategy Map | List
| Area | Menu | Feature role | Next work |
| ---------- | -------------------- | ----------------------------------------------------------- | ----------------------------------------- |
| Analysis | Keyword Status | Review SEO/AIO/GEO status and freshness by keyword | Select priority keywords, improve content |
| Analysis | Keyword Analysis | Review search performance and page/query movement | Monitor GSC/GA4 signals |
| Analysis | Prompt Status | Review mentions, sources, and citations across AI questions | Improve prompt sets, track engines |
| Analysis | Prompt Analysis | Interpret AI answer patterns and competitive exposure | Citation tracking, source strategy |
| Strategy | Strategy Map | Prioritize cluster-level GEO/SEO/AIO opportunities | Content briefs, reclustering |
| Strategy | Site Audit | Split web health and AI readiness into technical issues | Development or SEO tickets |
| Execution | Content Factory | Connect strategy analysis, writing, and evidence | Drafts, delivery documents |
| Execution | Content Export | Package content and report data for delivery | Client delivery, internal sharing |
| Monitoring | Monitoring Dashboard | Track GSC/GA4 and HaloX signal changes | Weekly meetings, improvement checks |
| Monitoring | Weekly Report | Package changes and next actions into a report | Client meetings, executive reporting |
| Misc | Personas | Manage tone, role, and writing style | Inputs for Content Factory |
| Misc | Evidence Library | Manage product, topic, and source facts | Evidence-based content and source trust |
## What should you inspect by area?
Keyword Status uses list and network views. Prompt Status separates prompts and sets. Weaknesses found here should move into Strategy Map or Content Factory.
Strategy Map uses list, network, matrix, and detail panels. Site Audit uses Overview, Issues, Pages, SEO, and GEO tabs to separate technical, content, and source problems.
Content Factory starts from the job list and continues into strategy analysis, content writing, and evidence tabs. Export packages the final deliverable.
Monitoring Dashboard uses overview, queries, and pages tabs. Weekly Report turns signal changes into a narrative and next actions.
## Tabs that must be documented
| Feature | Key tabs/views | Why it matters |
| ---------------------- | ------------------------------------------------- | ---------------------------------------------------------- |
| Keyword Status | List, Network | Keywords should be read as both rows and relationships. |
| Prompt Status | Prompts, Sets | Question analysis and operating sets need different views. |
| Strategy Map | List
Network
Matrix
detail panel | Each view explains priority differently. |
| Site Audit | Overview
Issues
Pages
SEO
GEO | Technical issues and AI readiness must be separated. |
| Content Factory detail | Strategy analysis, Content writing, Evidence | Teams need to know why a draft was produced. |
| Monitoring | Overview, Queries, Pages | Performance changes must be traced by query and page. |
## Operating sequence
Use the Pro sidebar for root-cause analysis and execution management. Lite is for first-pass diagnosis and quick status reading.
Separate keywords, prompts, sources, and competitive conditions.
Confirm the weekly priorities through Strategy Map clusters and Site Audit issues.
The loop should end in content, exports, and weekly reports.
## Pro sidebar area definitions
| Area | Menus | Purpose |
| ---------- | ---------------------------------------------------------------- | ------------------------------------------------------------------- |
| Dashboard | Dashboard | Starts with the overall state. |
| Analysis | Keyword Status, Keyword Analysis, Prompt Status, Prompt Analysis | Analyzes current search-keyword and AI-question signals. |
| Strategy | Strategy Map, Site Audit | Decides what to fix first through strategy and technical diagnosis. |
| Execute | Content Production, Content Export | Creates content and exports outputs. |
| Monitoring | Monitoring Dashboard, Weekly Report | Tracks traffic, citations, and weekly changes. |
| Etc | Personas, Knowledge Hub | Manages writing style and official evidence data. |
## Routes and purpose by menu
| Menu | Route | When to open it |
| -------------------- | ------------------- | -------------------------------------------------------- |
| Keyword Status | `/app/keywords` | To inspect keyword rank, AI citation, PAA, and progress. |
| Prompt Status | `/app/geo/prompts` | To inspect Mention, Source, and Citation by AI question. |
| Strategy Map | `/app/strategy-map` | To prioritize SEO/GEO gaps and clusters. |
| Site Audit | `/app/site-audit` | To inspect technical and structure issues. |
| Content Production | `/app/factory` | To turn strategy into content work. |
| Monitoring Dashboard | `/app/monitoring` | To read GSC/GA4 and AI-source traffic together. |
## Badges and workspace switching
| Item | Meaning | Caution |
| -------------------- | --------------------------------------------- | ------------------------------------------------------------- |
| Sidebar Badge | Indicates items or notifications in that menu | Check the source screen rather than reading the number alone. |
| Workspace Switcher | Changes the active workspace | Switching moves back to app home and changes data scope. |
| Trial / Plan display | Current plan or trial state | Use it to understand access or generation limits. |
## If you need the service metric definitions
Terms such as `rank`, `search volume`, `trend`, `AI`, `PAA`, `Citation Rate`, `Share of Voice`, and `gap type` are explained in the [screen metrics glossary](/en/glossary/screen-metrics). Use it when a KPI on this page needs a plain-language definition and a link back to the screen where it appears.
## Related docs
Compare the two workspace modes.
Use keyword lists and network views.
Track connected data and trends.
Create report narratives and next actions.
Package delivery outputs.