
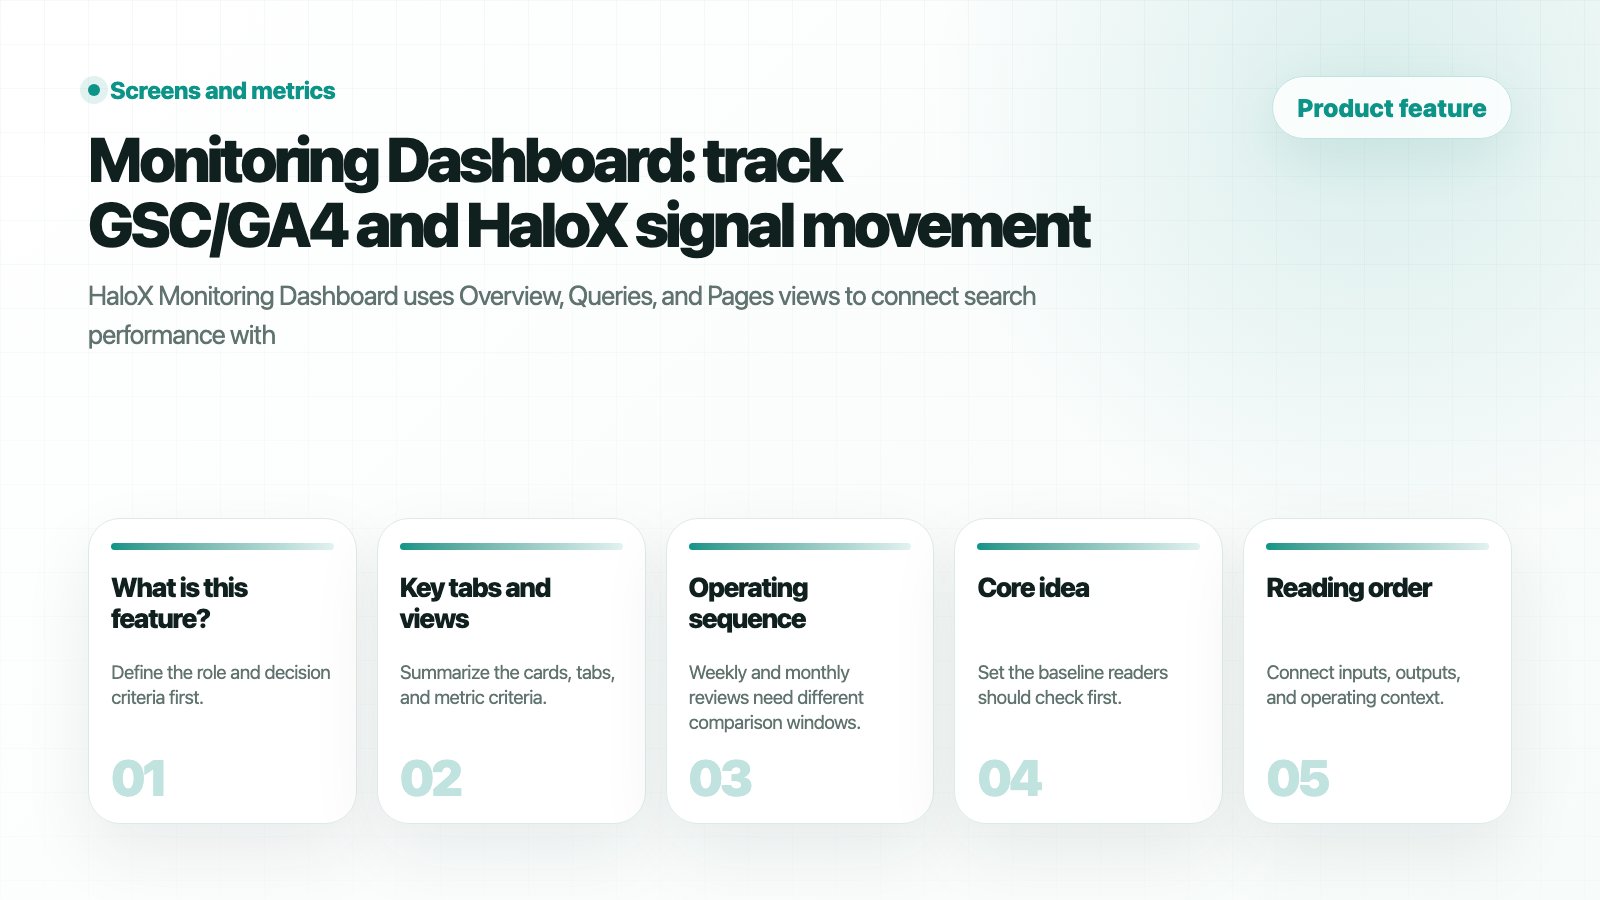
What is this feature?
Monitoring Dashboard tracks search performance and AI-source movement in Pro mode. Use it to collect the query and page evidence that later becomes a Weekly Report note. Overview reads search performance and AI traffic after the period filter is set. This is the baseline before separating a search performance problem from an AI citation problem.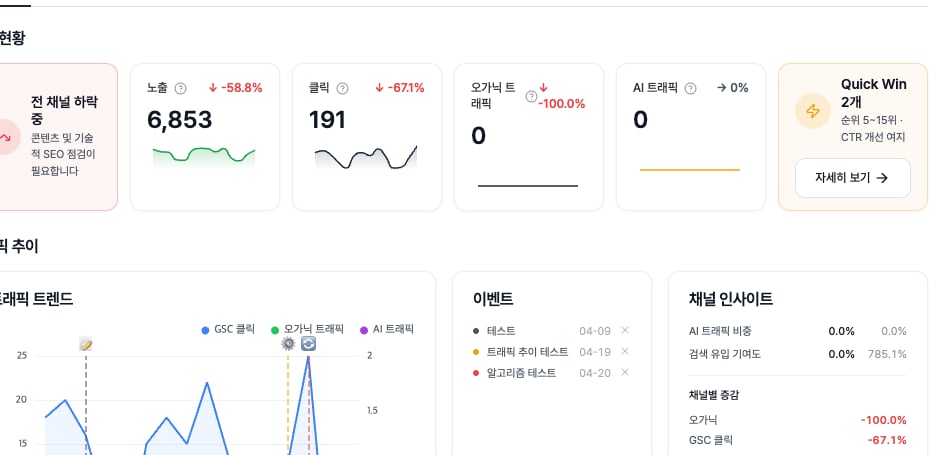
Monitoring Overview KPI cards
Key tabs and views
- Overview
- Queries
- Pages
Review AVI and search performance together. Before a meeting, write one line for what improved and one line for what is blocked.
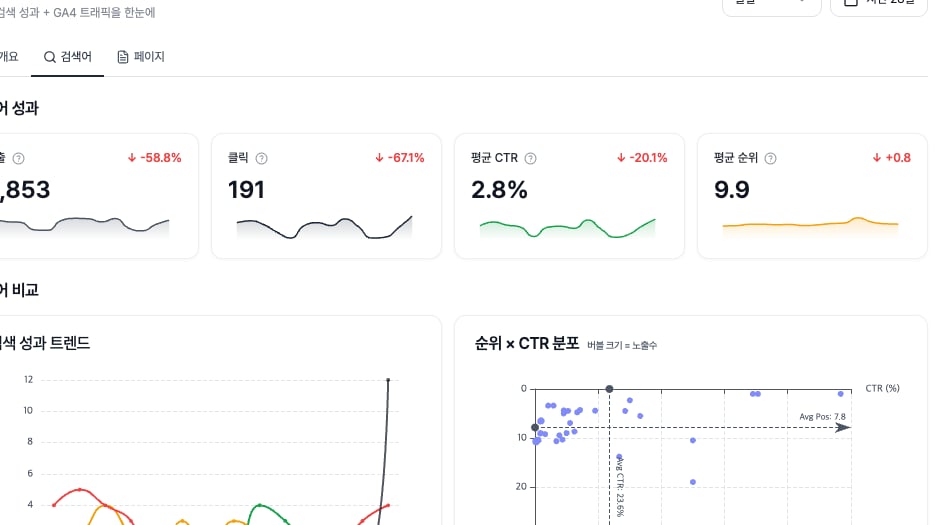
Monitoring Queries tab detail
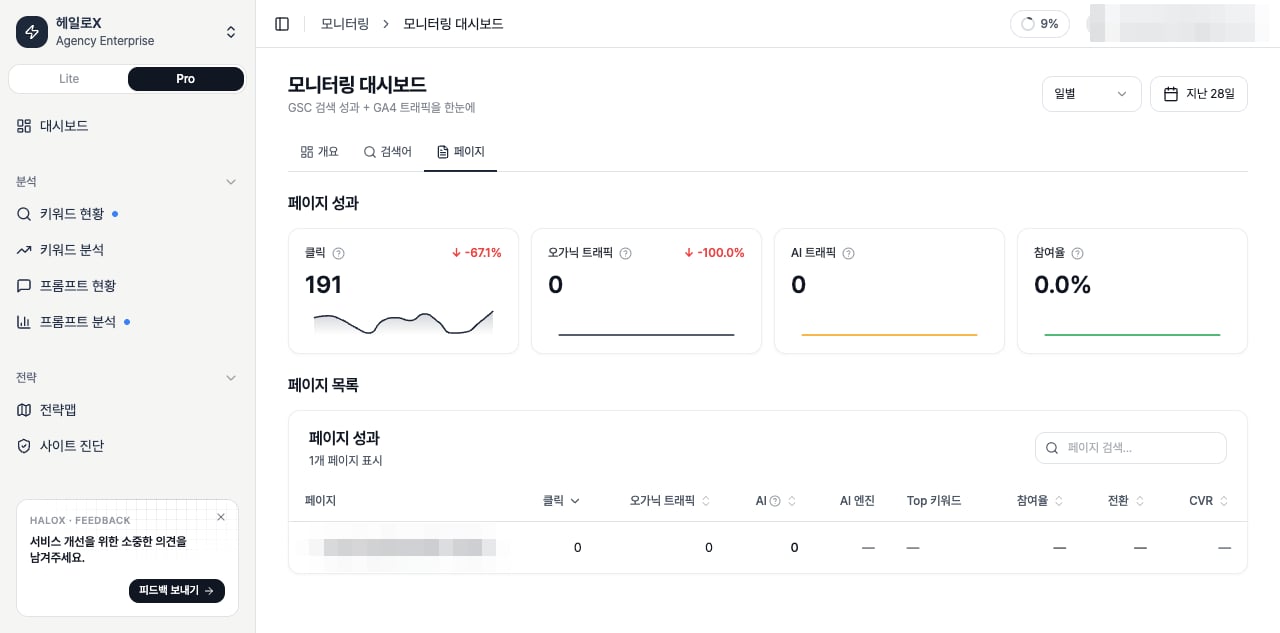
Monitoring Pages tab and URL performance table
Decisions the dashboard should produce
Operating sequence
1
1. Set the period filter first
Weekly and monthly reviews need different comparison windows.
2
2. Use Overview to understand direction
Read AVI, SEO, citation rate, and web health together instead of isolating one score.
3
3. Use Queries and Pages to narrow the cause
Decide whether the issue sits in query demand, page quality, source trust, or AI answer coverage.
4
4. Convert the finding into Weekly Report language
Write cause-and-action statements, not raw metric lists.
Data basis: GSC and GA4
Overview KPIs and channel decisions
Queries and Pages tab metrics
If you need the service metric definitions
Use the screen metrics glossary when a Monitoring KPI needs a definition or screen-level decision rule.Related docs
Weekly Report
Turn monitoring evidence into report language.
Keyword Analysis
Go deeper into queries and pages.
Reading scores
Translate metrics into meeting language.
GEO report example
Package client-ready reports.