
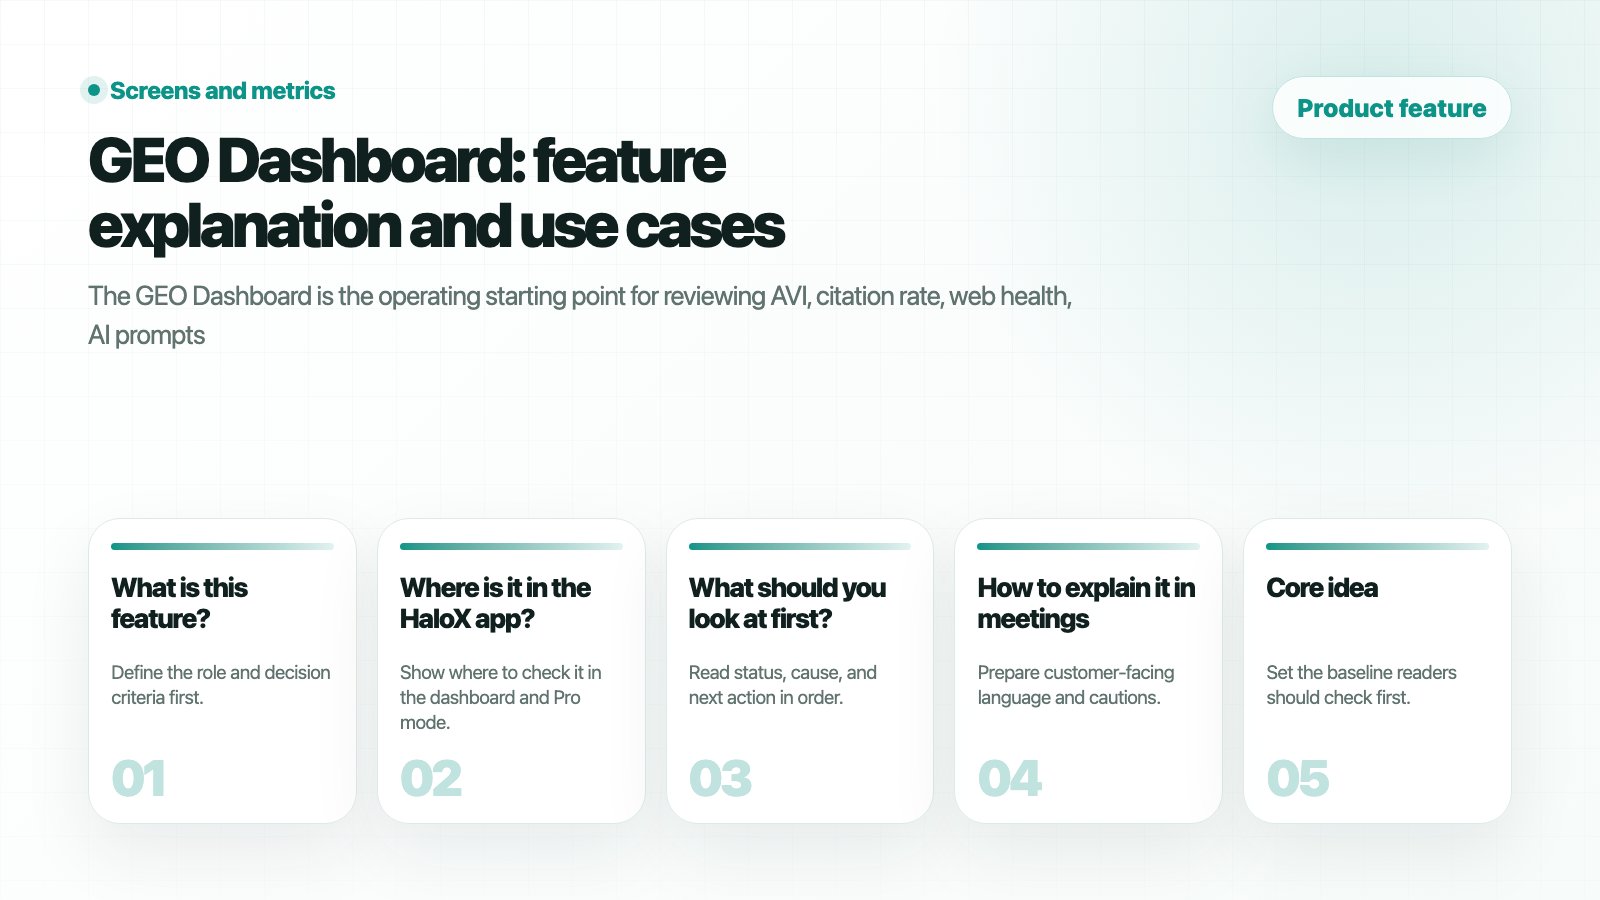
What is this feature?
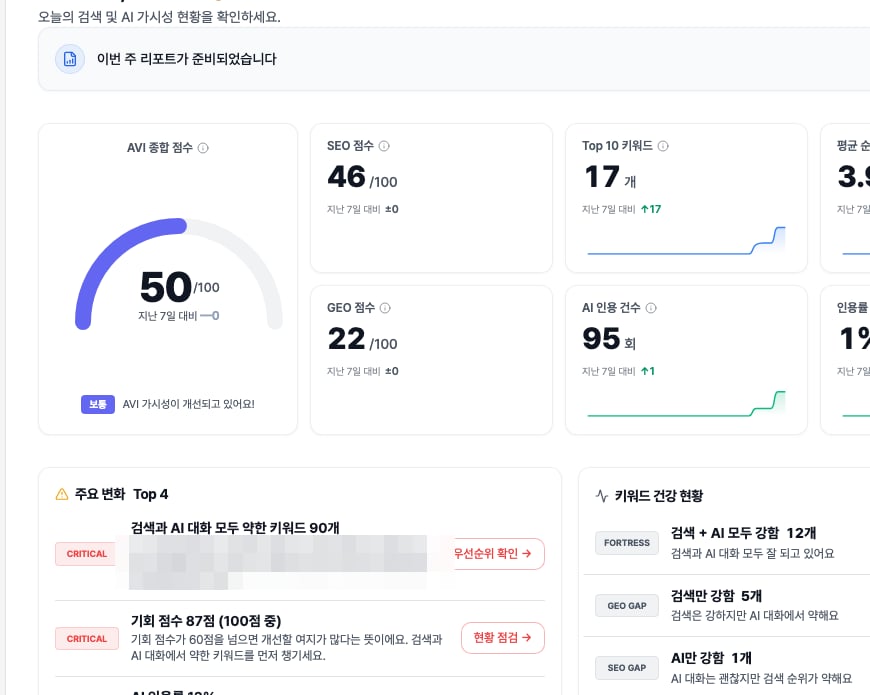
GEO Dashboard is the starting point for reading AI visibility, citation health and site readiness before choosing weekly priorities. It is a decision point in the HaloXdiagnose → measure → prioritize → execute → report loop. Teams use it to read the current signal, split the cause, and decide the next content, source, technical, or reporting action.
HaloX app location
Inputs and outputs
What should you look at first?
1
1. Summarize the state in one sentence
Replace “the score is low” with a cause-based sentence such as “official citations are weak for non-branded comparison prompts.”
2
2. Split the cause into four work types
Move technical blockers to Site Audit. Send question gaps to Prompt Analysis, source gaps to Citation Tracking, and content gaps to Content Factory.
3
3. Choose one next action
Turn the signal into one next action: a cluster update, page edit, FAQ, source task or weekly report note.
Main cards, tabs, or metrics
Practical use cases
How to explain it in meetings
“This feature shows how far the brand travels inside AI search answers and what content, source, or technical action should happen next.” Avoid customer names, real URLs, and internal KPIs in public documentation.FAQ
Does this feature complete the decision by itself?
No. HaloX features are connected. A signal in GEO Dashboard should move into Site Audit, Strategy Map, Content Factory, Citation Tracking, or weekly reporting.Do scores map directly to business results?
Most GEO metrics are leading indicators. Mentions and citations usually move first; traffic, branded search and conversion prompts are checked later.Related guides and concepts
Quickstart
Start the first 30-minute workflow.
Reading scores
Translate metrics into meeting language.
GEO glossary
Understand GEO, AVI, citation rate, and source visibility.
Reports
Turn movement into reporting language.
How to read the main KPI cards
Brand, Source, Citation funnel
Turning dashboard signals into actions
If you need the service metric definitions
Terms such asrank, search volume, trend, AI, PAA, Citation Rate, Share of Voice, and gap type are explained in the screen metrics glossary. Use it when a KPI on this page needs a plain-language definition and a link back to the screen where it appears.